

Rate of New Yorkers Working from Home More Than Doubled Since 2019, But Access Is Uneven
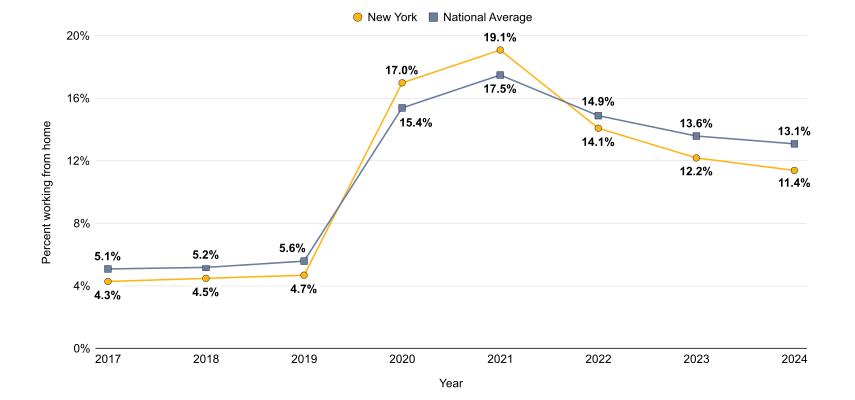
The share of New York workers who reported working primarily from home fell for the third consecutive year in 2024, but remained more than twice as high as pre-pandemic levels, according to data from the U.S. Census Bureau American Community Survey (ACS) Public Use Microdata Sample (PUMS).1 In 2024, 11.4 percent of employed New Yorkers worked from home, below the national rate of 13.1 percent.2
The ACS asks respondents how they usually got to work in the prior week, and one option is that respondents worked from their home address. In 2020, work-from-home rates surged with the onset of the pandemic and continued to grow in 2021, when nearly 1 in 5 workers indicated they worked from home. Since that peak, rates have declined annually.
Figure 1 – Work From Home Rates, New York and U.S., 2017-2024
- Figure 1 Data Table
Year Work From Home Percent New York Work From Home National Average 2017 4.3% 5.1% 2018 4.5% 5.2% 2019 4.7% 5.6% 2020 17.0% 15.4% 2021 19.1% 17.5% 2022 14.1% 14.9% 2023 12.2% 13.6% 2024 11.4% 13.1%
Source: IPUMS Extract of U.S. Census 2024 ACS 1-year PUMS
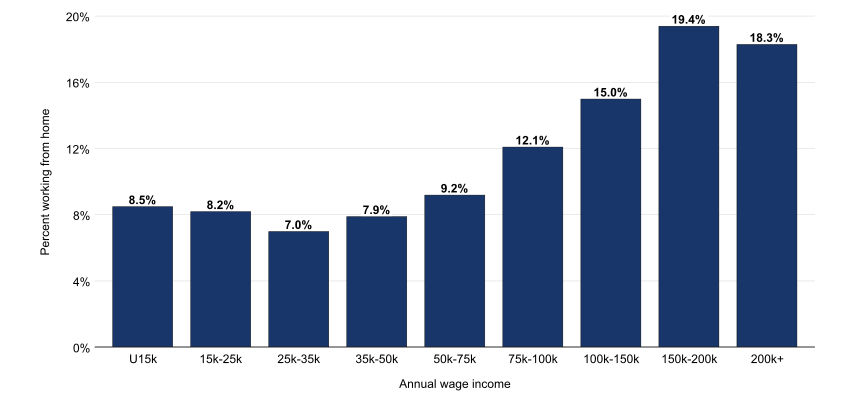
Some workers are more likely to work from home than others, with income strongly correlated with remote work access. Among workers in 20243 , those making $100,000 or more worked from home at twice the rate of those earning less than $50,000, reflecting occupational differences and the concentration of remote-eligible jobs among higher-paid workers.
Figure 2 – Work From Home Rates by Income, New York, 2024
- Figure 2 Data Table
Income Group Work From Home Percent U15k 8.5% 15k-25k 8.2% 25k-35k 7.0% 35k-50k 7.9% 50k-75k 9.2% 75k-100k 12.1% 100k-150k 15.0% 150k-200k 19.4% 200k+ 18.3%
Source: IPUMS Extract of U.S. Census 2024 ACS 1-year PUMS
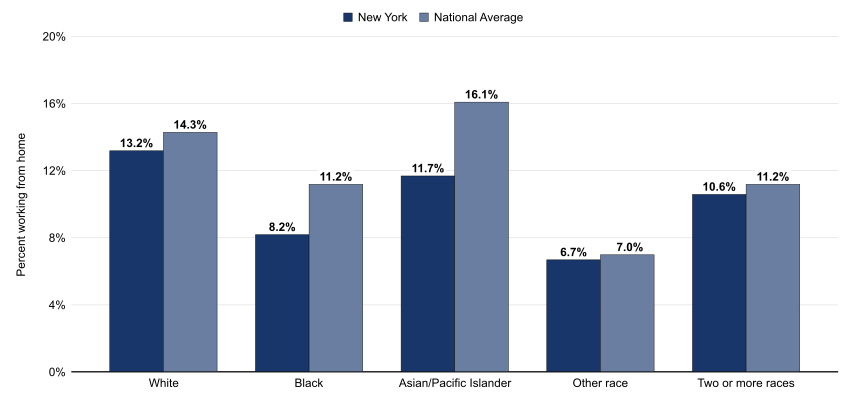
Work-from-home rates also vary across racial and ethnic groups. In New York, white workers (13.2 percent) worked from home at higher rates than Black workers (8.2 percent), a trend that mirrored the nation. Nationally, Asian/Pacific Islander workers reported the highest work-from-home rates.
Figure 3 – Work From Home Rates by Race, New York and U.S., 2024
- Figure 3 Data Table
Race Work From Home Percent National Average White 13.2% 14.3% Black 8.2% 11.2% Asian/Pacific Islander 11.7% 16.1% Other race 6.7% 7.0% Two or more races 10.6% 11.2%
Source: IPUMS Extract of U.S. Census 2024 ACS 1-year PUMS
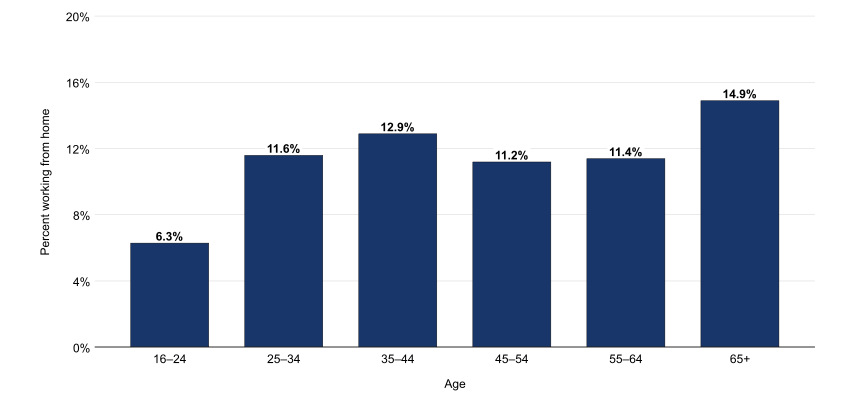
Age differences were modest across most age groups: workers in the 25-34, 35-44, 45-54, and 55-64 age groups reported similar work-from-home rates, ranging from 11.2 percent to 12.9 percent, while workers aged 65 and above had the highest rate at 14.9 percent.
Figure 4 – Work From Home Rates by Age, New York, 2024
- Figure 4 Data Table
Age Group Work From Home Percent 16-24 6.3% 25-34 11.6% 35-44 12.9% 45-54 11.2% 55-64 11.4% 65+ 14.9%
Source: IPUMS Extract of U.S. Census 2024 ACS 1-year PUMS
Hybrid Work Is Reshaping How New Yorkers Work
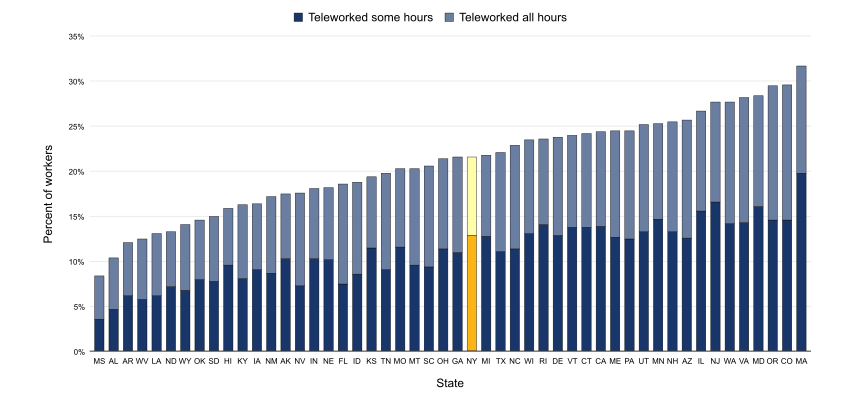
Data from the Bureau of Labor Statistics (BLS) offers additional insight into work-from-home habits.4 Approximately 60 percent of workers who teleworked during the previous week did so for only some of their work hours, suggesting that hybrid arrangements may be more common than fully remote work.5
New York ranked 17th out of all 50 U.S. states in the percentage of workers who teleworked some but not all of their hours; however, it only ranked 32nd in the percentage who exclusively teleworked. BLS data shows that from 2023 to 2025, the proportion of New York workers who teleworked some hours increased by 2.1 percentage points while the share who teleworked all hours remained stable with an increase of just 0.1 percentage point.
Figure 5 – Percentage of Workers Who Teleworked Some vs. All of Their Hours, 2024
- Figure 5 Data Table
State Total Teleworked some hours Teleworked all hours Mississippi 8.4% 3.5% 4.8% Alabama 10.4% 4.6% 5.7% Arkansas 12.1% 6.1% 5.9% West Virginia 12.4% 5.7% 6.7% Louisiana 13.0% 6.1% 6.9% North Dakota 13.2% 7.1% 6.1% Wyoming 14.0% 6.7% 7.3% Oklahoma 14.5% 7.9% 6.6% South Dakota 14.9% 7.7% 7.2% Hawaii 15.8% 9.5% 6.3% Kentucky 16.2% 8.0% 8.2% Iowa 16.4% 9.0% 7.3% New Mexico 17.0% 8.6% 8.5% Alaska 17.4% 10.2% 7.2% Nevada 17.4% 7.2% 10.3% Indiana 18.0% 10.2% 7.8% Nebraska 18.0% 10.1% 8.0% Florida 18.5% 7.4% 11.1% Idaho 18.7% 8.5% 10.2% Kansas 19.3% 11.4% 7.9% Tennessee 19.7% 9.0% 10.7% Missouri 20.2% 11.5% 8.7% Montana 20.3% 9.5% 10.7% South Carolina 20.5% 9.3% 11.2% Ohio 21.2% 11.3% 10.0% Georgia 21.5% 10.9% 10.6% New York 21.5% 12.8% 8.7% Michigan 21.8% 12.7% 9.0% Texas 22.0% 11.0% 11.0% North Carolina 22.8% 11.3% 11.5% Wisconsin 23.4% 13.0% 10.4% Rhode Island 23.5% 14.0% 9.5% Delaware 23.6% 12.8% 10.9% Vermont 23.9% 13.7% 10.2% Connecticut 24.0% 13.7% 10.4% California 24.3% 13.8% 10.5% Maine 24.3% 12.6% 11.8% Pennsylvania 24.4% 12.4% 12.0% Utah 25.1% 13.2% 11.9% Minnesota 25.2% 14.6% 10.6% New Hampshire 25.4% 13.2% 12.2% Arizona 25.6% 12.5% 13.1% Illinois 26.6% 15.5% 11.1% New Jersey 27.5% 16.5% 11.1% Washington 27.6% 14.1% 13.5% Virginia 28.1% 14.2% 13.9% Maryland 28.3% 16.0% 12.3% Oregon 29.3% 14.5% 14.9% Colorado 29.5% 14.5% 15.0% Massachusetts 31.6% 19.7% 11.9%
Source: BLS Telework Data
Broader Impacts of Changing Work Patterns
Remote and hybrid work remain important features of New York’s labor market even as overall rates have declined from their pandemic-era peak, with important implications for regional economies. A 2026 Government Accountability Office (GAO) analysis found that increased telework rates contributed to lower public transit usage, changes in vehicle travel patterns, and shifts in demand for commercial real estate.6 Analysis from the Office of the New York State Comptroller indicates that three of four major upstate regional transportation authorities had not reached pre-pandemic ridership levels as of 2024, and 2025 MTA weekday subway ridership was just 74 percent of its 2019 level.
Remote work may also expand employment opportunities. A 2025 Office of the State Comptroller report found that remote work opportunities may have helped spur a meaningful post-COVID increase in labor force participation among people with disabilities. Working from home can reduce commuting barriers and improve work performance for disabled workers, though access to remote work is still limited and varies substantially between industries and occupations.7
Looking Ahead
As remote and hybrid work continue to evolve, policymakers should account for changing work patterns when planning transportation, infrastructure, and economic development. Understanding who does and does not have access to remote work remains central to developing equitable and responsive policies.
Endnotes
1 U.S. Census Bureau, American Community Survey 2017-2024 1-Year Public Use Microdata Sample (PUMS), at https://www.census.gov/programs-surveys/acs/microdata/access.html. Accessed through IPUMS: Steven Ruggles, et al. IPUMS USA: Version 16.0 [dataset]. Minneapolis, MN: IPUMS, 2025. https://doi.org/10.18128/D010.V16.0. One-year estimates were used for this report.
2 A small number of sampled individuals had no response listed for this question. The weighted proportion of N/A responses in 2024 in New York was 2.12 percent. From 2017 to 2024, the proportion was between 2.10 percent (in 2019) and 3.69 percent (in 2020). Nationwide, the weighted proportion of N/A responses for this question spanned from 1.90 percent (in 2024) to 2.71 percent (in 2020).
3 Income analysis includes only people identified as employed who reported positive wage income.
4 Bureau of Labor Statistics (BLS), Local Area Unemployment Statistics: Additional State Data from the CPS, September 5, 2025, at bls.gov/lau/additional-state-cps-data.htm#telework.
5 Many of these hybrid workers may not be counted by ACS PUMS estimates, since they may report travel to an office as their primary work commute.
6 Government Accountability Office (GAO), Telework and Changing Travel Patterns: Department of Transportation Should Develop Guidance to Help Communities Prioritize Investments, March 11, 2026.
7 Betsy Lake & David W. Maidment. “’Is This a New Dawn for Accessibility?’ A qualitative interview study assessing remote working experiences in adults with physical disabilities post COVID-19,” WORK: A Journal of Prevention, Assessment & Rehabilitation, 76(2), 437-451, at https://doi.org/10.3233/WOR-220622.