

New York City Economic and Fiscal Monitoring
The Office of the State Deputy Comptroller for the City of New York monitors New York City's fiscal condition, assists the New York State Financial Control Board, and regularly reports on the City's financial plans, major budgetary and policy issues; economic and economic development trends, and budgetary and policy issues affecting public authorities in the region, including the Metropolitan Transportation Authority. For questions, contact us at [email protected].
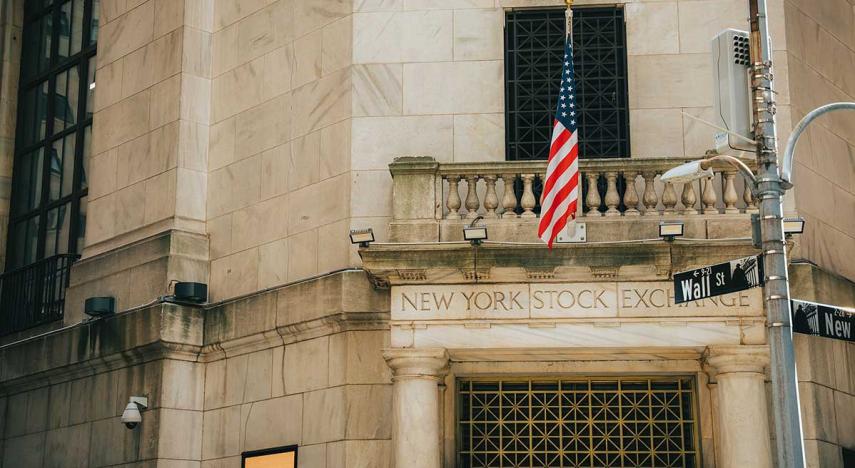
The Securities Industry in New York City
Wall Street First-Half Profits Soar to Nearly $46 Billion
Wall Street is on pace for a far stronger year than anticipated, with profits reaching $45.9 billion in the first half of 2026, up 51.3% from the same period last year. First-half profits have already surpassed New York City’s $45.3 billion forecast for the entire year, and if the pace of growth continues, profits could exceed $90 billion in 2026.
Read Report
The Retail Sector in New York City Post-Pandemic Trends
Sales Increase but Job Growth Stalls
Retail spending in New York City bounced back quickly after the pandemic, but it has slowed and remains uneven. Clothing and food retailers saw modest employment gains, but other industries, especially furniture, electronics and general merchandise continue to shed jobs.
Read Report
State Grants to New York City
Education and Social Services Funding at Risk if Federal Aid to the State Declines
About 17% of the city’s total revenue for Fiscal Year 2027, totaling over $21 billion, comes from state aid, including substantial categorical grant funding for essential programs for children, families, and vulnerable residents. Major education and social service programs in New York City could be in jeopardy if federal funding cuts to the state occur.
Family Services Safety Net Assistance
Charter School Tuition and Lease Aid

25 Years Later: The Transformation of Lower Manhattan – An Economic Snapshot
Report Highlights Growth, Resilience, and Transformation of Neighborhoods Around Ground Zero
Lower Manhattan has undergone a profound transformation in the 25 years since the terror attacks on Sept. 11, 2001. The area boasts a diversified business community, an expanding tourism sector, major public transportation investments, and the emergence of a 24-hour neighborhood that has seen the number of housing units and residents more than double since 2000.
Read Report
Never Forget: A Snapshot of the 9/11 Memorial & Museum
highlights the work of the 9/11 Memorial & Museum to educate the public and support 9/11 families
Between 2018 to 2025, the 9/11 Memorial welcomed 57 million visitors and the museum hosted more than 16 million visitors. In 2025 alone, the Memorial welcomed 11.3 million visitors and the Museum saw 2.4 million visitors. Visitation to the Museum has been steady in recent years, although still lagging pre-pandemic levels of more than 3.1 million in 2019. Memorial attendance, however, now exceeds pre-pandemic levels.
Read Report
Review of the Financial Plan of the City of New York
Budget Better Reflects Actual Costs, but Future Gaps Could Worsen
New York City’s $127.8 billion fiscal year (FY) 2027 budget, inclusive of prepayments of certain expenses, is nearly $5.9 billion more than projected at the same point last year, a significant increase that includes addressing known costs that were left out of previous financial plans. While the city was able to achieve budgetary balance in FY 2027, it shows a structural imbalance that could worsen if sustainable solutions are not found.
Read Report
Business Costs in New York City: Historical Data and City Comparisons
REPORT SHOWS HOW NYC’S BUSINESS COSTS COMPARE TO OTHER MAJOR METROPOLITAN AREAS
New York City remains one of the nation’s most expensive places to start or operate a business, but several major business expenses have grown at a slower rate than in competing metropolitan areas over the past decade.
Read Report
The Hotel Industry in New York City
Demand for NYC Hotels Leads U.S., but International Visitors Still Lagging
New York City’s hotel industry is one of the nation’s strongest, with high demand for rooms led by a surge in domestic visitors, but it remains vulnerable to changes in tourism and the continued loss of international travelers due to geopolitical instability.
Read Report
New York City Government Services
Reports Analyze City Services, Spending, and Performance Outcomes
New York City provides a wide array of services to residents. Managing the City’s budget requires that it assess whether services are provided to those in need and in a cost-efficient manner. These reports use City budget and performance data to analyze where services are reaching City targets, where improvements can be made and where more data is necessary to understand the provision of these services.
Older Adult Case Management and Home Care
Review of the Financial Plan of the City of New York
Budget Balanced, But Risks Threaten Long-Term Fiscal Stability
The $124.7 billion fiscal year 2027 budget released in May continued the City’s recent efforts to lay bare the substantial spending challenges it faces while identifying some recurring solutions to managing these challenges.
Read Report
Annual Update: Metropolitan Transportation Authority’s Debt Profile
Highlights Progress on Capital Investments and Debt Management
Despite ongoing federal uncertainties, the Metropolitan Transportation Authority has taken strides in advancing both its 2020-2024 and 2025-2029 capital programs. As of April 2026, the Authority has committed more than $38 billion from its $55.4 billion 2020-2024 program, reflecting both more financing certainty and accelerated project activity.
Read Report
MTA Weekend Ridership Trends
Weekend Ridership Recovery Outpaces Weekdays Across the Board
Weekend ridership recovery across Metropolitan Transportation Authority (MTA) services has risen faster than weekdays since the pandemic ended, with average ridership near 2019 levels and even exceeding it at times. The recovery gap between weekends and weekdays has accelerated in recent years, suggesting the MTA continue to adjust service in response.
Read Report
Review of the Financial Plan of the City of New York
NYC Budget Increases Transparency, Reveals Structural Gaps
New York City’s $127 billion fiscal year 2027 preliminary budget (February Plan) provides more transparency for spending, addressing years of chronic underbudgeting and exposing an emerging structural budget gap that may require choices that threaten the city’s fiscal stability, competitiveness and affordability.
Read Report
New York City’s Uneven Recovery: An Update on Labor Force Trends
Economic and Policy Insights
The December unemployment rate in New York City remained higher than pre-pandemic levels for several demographic groups, particularly for youths and Blacks. This report also finds that non-college-educated unemployment is closer to pre-pandemic levels than college-educated unemployment, a major shift from earlier in the decade.
Read Report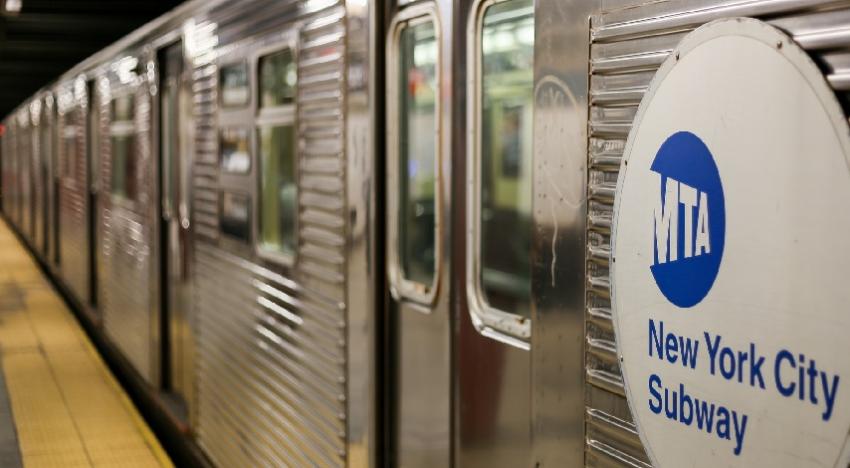
Subway Recovery Tracker
Impact of the COVID-19 Pandemic on Subway Ridership in New York City
The COVID-19 pandemic had a profound and disparate impact on subway ridership in New York City. Initially, the emergence of the virus in March and April 2020 corresponded with a steep and uniform drop in subway usage across all five boroughs. Citywide, April 2020 ridership was just 8.3 percent of what it was in April 2019, and through the summer of 2024 ridership has yet to regularly surpass 70 percent of pre-pandemic levels.
View Dashboard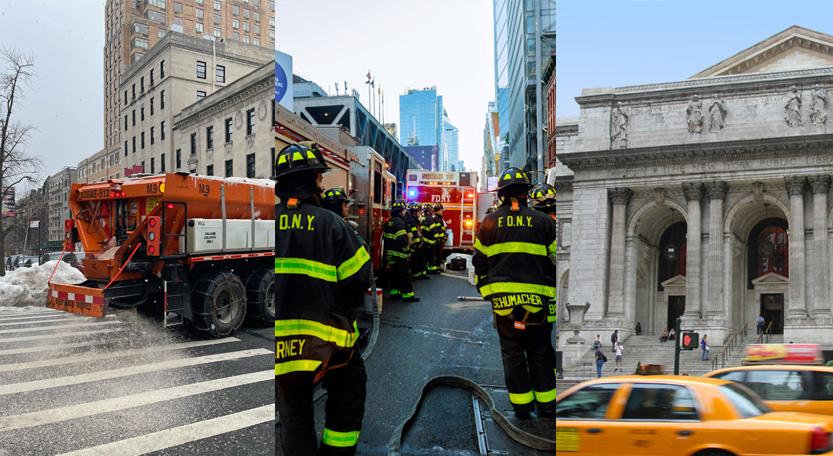
Agency Services Monitoring Tool
MONTHLY UPDATES TRACK PERFORMANCE, STAFFING AND SPENDING
The Office of the New York State Comptroller developed a tool that displays performance indicators, staffing levels and spending commitments assigned to a City service since January 2020. While there are many factors that affect service demand and provision, the tool can provide some insight on existing operational or budgetary phenomena or the emergence of potential risks to the City’s budget and the provision of certain services.
View Dashboard
New York City Industry Sector Dashboards
MONTHLY UPDATES TRACK THE CITY’S ECONOMIC RECOVERY
The COVID-19 pandemic hit New York City particularly hard, causing massive job losses at major employers such as restaurants, hotels and retail stores. These dashboards follow a series of reports released over the past two years tracking economic data and the effect of the pandemic on these critical sectors and will help identify areas of weakness as well as positive developments.
Federal Funding to New York City
CUTS IN FEDERAL AID POSE RISKS TO CITY BUDGET
New York City’s proposed Fiscal Year (FY) 2026 operating budget relies on $7.4 billion in federal government funding, accounting for 6.4% of total spending. Recent federal government actions to cut grant programs could jeopardize at least $535 million of federal aid in FY 2025 and FY 2026, but nearly all federal operating aid that flows to the City could be subject to cuts or elimination.
View Guide