Admin
NYC311 Monitoring Tool
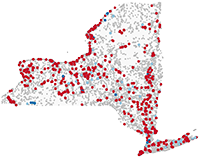
Non-emergency 311 calls in New York City climbed to over 3.4 million in 2024, up 7% from 2023. To increase transparency and help the city respond to growing quality of life complaints, the Office of the New York State Comptroller released a report highlighting trends in service requests over the past five years, and an interactive NYC311 Monitoring Tool to let people see requests in their neighborhood and help identify where resources may be needed.
Hero Banner - NYC311
Breaks Down Complaints by Neighborhood So You Can See Where Help Is Needed.
DiNapoli Releases New Tool for Monitoring NYC 311 Complaints
Non-emergency 311 calls have increased dramatically in New York City since the COVID-19 pandemic. To increase transparency and help the city respond to growing quality of life complaints, State Comptroller Thomas P. DiNapoli launched the NYC311 Monitoring Tool, an interactive dashboard that will let people see service requests in their neighborhood and help identify where resources may be needed.
Essential Plan County Breakout
County | Enrollment | Percent Enrolled |
---|---|---|
Albany | 14,624 | 4.6% |
Allegany | 2,057 | 4.4% |
Broome | 9,873 | 5.0% |
Cattaraugus | 3,678 | 4.9% |
Cayuga | 3,603 | 4.8% |
Chautauqua | 5,998 | 4.8% |
Chemung | 3,936 | 4.8% |
Chenango | 2,477 | 5.4% |
Clinton | 3,261 | 4.2% |
Columbia | 3,904 | 5.1% |
Cortland | 2,525 | 5.5% |
Delaware | 2,117 | 4.8% |
Dutchess | 14,066 | 4.7% |
Erie | 46,442 | 4.9% |
Essex | 1,754 | 4.8% |
Franklin | 2,154 | 4.6% |
Fulton | 3,144 | 6.0% |
Genesee | 2,641 | 4.6% |
Greene | 2,302 | 4.9% |
Hamilton | 224 | 4.4% |
Herkimer | 3,189 | 5.4% |
Jefferson | 5,198 | 4.5% |
Lewis | 1,357 | 5.1% |
Livingston | 2,537 | 4.1% |
Madison | 2,817 | 4.2% |
Monroe | 40,714 | 5.4% |
Montgomery | 2,852 | 5.8% |
Nassau | 102,623 | 7.4% |
Niagara | 10,511 | 5.0% |
Oneida | 12,165 | 5.3% |
Onondaga | 22,648 | 4.8% |
Ontario | 4,887 | 4.3% |
Orange | 23,463 | 5.8% |
Orleans | 2,897 | 7.4% |
Oswego | 5,736 | 4.9% |
Otsego | 2,594 | 4.3% |
Putnam | 4,279 | 4.4% |
Rensselaer | 6,641 | 4.2% |
Rockland | 25,028 | 7.3% |
St. Lawrence | 4,531 | 4.2% |
Saratoga | 8,391 | 3.5% |
Schenectady | 9,899 | 6.2% |
Schoharie | 1,376 | 4.6% |
Schuyler | 833 | 5.0% |
Seneca | 1,432 | 4.4% |
Steuben | 4,749 | 5.2% |
Suffolk | 116,828 | 7.7% |
Sullivan | 4,669 | 5.8% |
Tioga | 2,321 | 4.9% |
Tompkins | 3,570 | 3.4% |
Ulster | 9,703 | 5.3% |
Warren | 3,368 | 5.2% |
Washington | 3,145 | 5.2% |
Wayne | 4,853 | 5.3% |
Westchester | 55,711 | 5.6% |
Wyoming | 1,666 | 4.2% |
Yates | 1,173 | 4.8% |
New York City | 1,017,645 | $63,950,866 |
Bronx | 172,021 | 12.7% |
Kings | 329,293 | 12.9% |
New York | 95,563 | 6.0% |
Queens | 369,951 | 16.4% |
Richmond | 40,971 | 8.3% |
State Comptroller DiNapoli Releases Municipal Audits
New York State Comptroller Thomas P. DiNapoli today announced the following local government audits were issued.
Federal Funding and New York Map - Medicaid Enrollment by County
District | Enrollment | Percent Enrolled |
---|---|---|
Albany | 71,045 | 22.4% |
Allegany | 12,538 | 26.9% |
Bronx | 924,530 | 68.2% |
Broome | 56,290 | 28.7% |
Cattaraugus | 21,402 | 28.3% |
Cayuga | 19,893 | 26.7% |
Chautauqua | 38,794 | 31.1% |
Chemung | 29,303 | 36.0% |
Chenango | 14,177 | 30.9% |
Clinton | 19,773 | 25.3% |
Columbia | 14,453 | 23.9% |
Cortland | 11,995 | 26.2% |
Delaware | 10,255 | 23.1% |
Dutchess | 62,580 | 21.1% |
Erie | 253,616 | 26.8% |
Essex | 8,084 | 22.0% |
Franklin | 14,480 | 31.1% |
Fulton | 14,664 | 28.1% |
Genesee | 12,941 | 22.5% |
Greene | 12,167 | 25.9% |
Hamilton | 698 | 13.7% |
Herkimer | 16,352 | 27.5% |
Jefferson | 28,886 | 25.2% |
Kings (Brooklyn) | 1,294,232 | 50.5% |
Lewis | 5,191 | 19.6% |
Livingston | 11,770 | 19.2% |
Madison | 15,650 | 23.4% |
Monroe | 199,607 | 26.7% |
Montgomery | 18,522 | 37.5% |
Nassau | 308,393 | 22.3% |
New York (Manhattan) | 480,783 | 30.1% |
Niagara | 53,908 | 25.7% |
Oneida | 70,591 | 31.0% |
Onondaga | 119,079 | 25.5% |
Ontario | 22,594 | 20.1% |
Orange | 127,170 | 31.2% |
Orleans | 10,970 | 28.0% |
Oswego | 33,283 | 28.2% |
Otsego | 13,146 | 21.9% |
Putnam | 17,815 | 18.2% |
Queens | 1,110,863 | 49.3% |
Rensselaer | 35,670 | 22.4% |
Richmond (Staten Island) | 181,942 | 37.1% |
Rockland | 151,661 | 44.5% |
Saint Lawrence | 28,375 | 26.5% |
Saratoga | 36,632 | 15.3% |
Schenectady | 47,439 | 29.7% |
Schoharie | 7,093 | 23.6% |
Schuyler | 3,498 | 20.0% |
Seneca | 7,660 | 23.7% |
Steuben | 26,202 | 28.4% |
Suffolk | 366,980 | 24.1% |
Sullivan | 28,276 | 35.4% |
Tioga | 11,984 | 25.1% |
Tompkins | 16,443 | 15.9% |
Ulster | 48,678 | 26.7% |
Warren | 15,621 | 23.9% |
Washington | 16,348 | 27.2% |
Wayne | 21,397 | 23.6% |
Westchester | 239,949 | 24.2% |
Wyoming | 8,849 | 22.4% |
Yates | 4,962 | 20.3% |
Federal Funding and New York Map - Individuals Receiving Housing Assistance
District | Housing Choice Vouchers | Project-Based Section 8 | Public Housing |
---|---|---|---|
Albany County | 6,585 | 2,556 | 2,390 |
Allegany County | 203 | 0 | 0 |
Bronx County | 114,703 | 27,922 | 61,440 |
Broome County | 2,071 | 821 | 1,093 |
Cattaraugus County | 742 | 102 | 627 |
Cayuga County | 1,638 | 501 | – |
Chautauqua County | 1,981 | 1,092 | 641 |
Chemung County | 1,955 | 862 | 617 |
Chenango County | 424 | 164 | 147 |
Clinton County | 1,171 | 329 | 1,078 |
Columbia County | 722 | 607 | – |
Cortland County | 458 | 204 | 445 |
Delaware County | 963 | 249 | – |
Dutchess County | 5,049 | 1,350 | 884 |
Erie County | 20,880 | 8,350 | 6,711 |
Essex County | 506 | 174 | – |
Franklin County | 1,090 | 189 | 570 |
Fulton County | 819 | 102 | 382 |
Genesee County | 949 | 200 | 314 |
Greene County | 460 | 185 | 205 |
Hamilton County | – | – | – |
Herkimer County | 1,248 | 541 | – |
Jefferson County | 2,034 | 1,102 | 1,280 |
Kings County | 116,882 | 28,463 | 79,562 |
Lewis County | 475 | 85 | – |
Livingston County | 535 | 386 | – |
Madison County | 1,007 | 198 | – |
Monroe County | 17,894 | 5,264 | 2,587 |
Montgomery County | 1,674 | 530 | 161 |
Nassau County | 9,305 | 4,167 | 3,754 |
New York County | 36,584 | 28,466 | 79,096 |
Niagara County | 3,350 | 1,768 | 1,817 |
Oneida County | 5,280 | 2,127 | 1,797 |
Onondaga County | 10,537 | 3,240 | 4,013 |
Ontario County | 1,602 | 831 | 103 |
Orange County | 17,687 | 1,023 | 398 |
Orleans County | 379 | 180 | – |
Oswego County | 2,465 | 363 | 108 |
Otsego County | 359 | 118 | – |
Putnam County | 863 | 65 | – |
Queens County | 27,163 | 8,444 | 28,041 |
Rensselaer County | 4,039 | 948 | 447 |
Richmond County | 9,824 | 5,122 | 5,835 |
Rockland County | 20,504 | 2,677 | 319 |
Saratoga County | 3,001 | 504 | 449 |
Schenectady County | 3,795 | 1,074 | 1,213 |
Schoharie County | 419 | – | – |
Schuyler County | 110 | 76 | – |
Seneca County | 737 | 87 | – |
St. Lawrence County | 929 | 473 | 1,161 |
Steuben County | 1,325 | 936 | 95 |
Suffolk County | 17,128 | 3,141 | – |
Sullivan County | 3,312 | 952 | 119 |
Tioga County | 356 | 79 | – |
Tompkins County | 3,915 | 43 | 326 |
Ulster County | 3,995 | 835 | 119 |
Warren County | 1,178 | 653 | – |
Washington County | 640 | 90 | – |
Wayne County | 1,285 | 557 | – |
Westchester County | 27,880 | 8,725 | 3,131 |
Wyoming County | 248 | 36 | – |
Yates County | 190 | 20 | – |
Social Security County Breakout
District | Total Beneficiaries | Total Benefits |
---|---|---|
Albany | 64,670 | $123,459 |
Allegany | 11,840 | $19,448 |
Broome | 47,690 | $83,064 |
Cattaraugus | 20,430 | $33,501 |
Cayuga | 18,580 | $32,736 |
Chautauqua | 34,180 | $57,510 |
Chemung | 21,750 | $36,805 |
Chenango | 13,475 | $22,069 |
Clinton | 21,565 | $35,851 |
Columbia | 16,790 | $31,899 |
Cortland | 10,265 | $17,630 |
Delaware | 12,555 | $21,571 |
Dutchess | 64,505 | $129,960 |
Erie | 212,845 | $390,823 |
Essex | 10,415 | $18,266 |
Franklin | 12,880 | $20,438 |
Fulton | 14,660 | $24,074 |
Genesee | 14,915 | $26,361 |
Greene | 13,010 | $23,392 |
Hamilton | 1,670 | $3,043 |
Herkimer | 16,170 | $26,717 |
Jefferson | 23,655 | $38,786 |
Lewis | 6,410 | $10,381 |
Livingston | 15,570 | $28,402 |
Madison | 16,310 | $29,298 |
Monroe | 169,910 | $323,449 |
Montgomery | 13,560 | $22,330 |
Nassau | 270,745 | $575,837 |
Niagara | 55,530 | $99,225 |
Oneida | 56,740 | $95,785 |
Onondaga | 102,590 | $192,386 |
Ontario | 29,460 | $55,509 |
Orange | 70,165 | $134,867 |
Orleans | 10,445 | $18,075 |
Oswego | 29,740 | $51,642 |
Otsego | 15,405 | $26,417 |
Putnam | 20,590 | $44,420 |
Rensselaer | 35,795 | $65,693 |
Rockland | 55,725 | $114,667 |
St. Lawrence | 26,875 | $44,010 |
Saratoga | 55,410 | $108,700 |
Schenectady | 34,305 | $61,863 |
Schoharie | 8,400 | $14,425 |
Schuyler | 5,325 | $9,225 |
Seneca | 8,635 | $14,793 |
Steuben | 24,660 | $41,411 |
Suffolk | 312,015 | $641,557 |
Sullivan | 18,755 | $32,633 |
Tioga | 13,160 | $22,815 |
Tompkins | 17,775 | $34,747 |
Ulster | 43,680 | $82,615 |
Warren | 19,985 | $36,481 |
Washington | 16,000 | $27,197 |
Wayne | 24,750 | $44,232 |
Westchester | 176,205 | $378,271 |
Wyoming | 10,010 | $17,405 |
Yates | 6,445 | $11,435 |
Bronx | 211,145 | $299,022 |
Kings | 358,150 | $541,472 |
New York | 261,110 | $494,646 |
Queens | 365,555 | $583,194 |
Richmond | 93,295 | $173,922 |
New York City |
Federal Funding and New York Map - NY County SNAP Benefits
District | January 2025 SNAP Persons | January 2025 Total SNAP Benefits |
---|---|---|
Albany | 32,544 | $6,508,755 |
Allegany | 5,319 | $918,135 |
Broome | 26,276 | $5,071,458 |
Cattaraugus | 10,630 | $1,874,855 |
Cayuga | 8,977 | $1,649,132 |
Chautauqua | 23,653 | $4,485,327 |
Chemung | 14,461 | $2,818,947 |
Chenango | 6,838 | $1,180,196 |
Clinton | 11,833 | $2,232,539 |
Columbia | 5,160 | $978,689 |
Cortland | 5,649 | $1,056,098 |
Delaware | 4,684 | $822,915 |
Dutchess | 17,152 | $3,413,741 |
Erie | 142,028 | $28,295,909 |
Essex | 3,030 | $526,919 |
Franklin | 6,681 | $1,255,498 |
Fulton | 8,095 | $1,535,489 |
Genesee | 4,864 | $854,770 |
Greene | 3,876 | $782,515 |
Hamilton | 373 | $64,089 |
Herkimer | 9,085 | $1,659,171 |
Jefferson | 14,507 | $2,687,271 |
Lewis | 2,925 | $468,666 |
Livingston | 5,537 | $1,009,467 |
Madison | 6,295 | $1,141,722 |
Monroe | 108,714 | $22,358,035 |
Montgomery | 8,430 | $1,557,023 |
Nassau | 44,106 | $8,661,574 |
Niagara | 27,303 | $5,252,833 |
Oneida | 34,917 | $7,200,947 |
Onondaga | 66,884 | $13,166,244 |
Ontario | 9,405 | $1,740,508 |
Orange | 45,530 | $8,594,551 |
Orleans | 5,292 | $932,774 |
Oswego | 17,156 | $3,166,664 |
Otsego | 6,634 | $1,194,318 |
Putnam | 2,885 | $597,084 |
Rensselaer | 15,892 | $3,034,139 |
Rockland | 53,004 | $10,286,808 |
Saratoga | 14,575 | $2,669,983 |
Schenectady | 21,073 | $4,254,091 |
Schoharie | 3,805 | $680,418 |
Schuyler | 1,937 | $333,907 |
Seneca | 3,593 | $626,937 |
St. Lawrence | 13,860 | $2,536,625 |
Steuben | 12,283 | $2,142,272 |
Suffolk | 130,456 | $28,667,217 |
Sullivan | 13,110 | $2,679,440 |
Tioga | 5,350 | $881,888 |
Tompkins | 7,737 | $1,508,409 |
Ulster | 17,521 | $3,556,417 |
Warren | 6,947 | $1,272,495 |
Washington | 6,944 | $1,222,424 |
Wayne | 8,606 | $1,551,906 |
Westchester | 74,181 | $15,587,852 |
Wyoming | 2,570 | $423,286 |
Yates | 2,101 | $360,750 |
New York City | 1,801,636 | $423,861,133 |