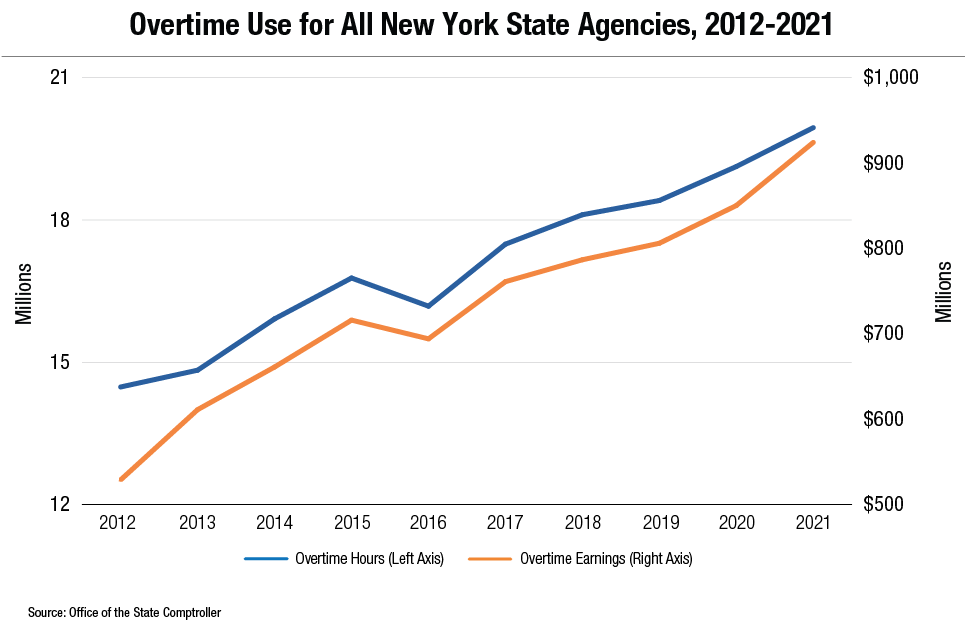
The total cost of overtime in 2021 reached an all-time high at more than $924 million, up 8.7% from 2020, covering roughly 19.95 million overtime hours worked, or an increase of 4.3%, according to a report released today by State Comptroller Thomas P. DiNapoli. Total overtime hours worked at state agencies have increased by 38% since 2012, while the number of employees has declined by more than 10% at 10 major agencies.
“As state government grappled with the impacts of the pandemic, overtime costs set a new record in 2021,” said DiNapoli. “While the pandemic does not appear to have prompted a ‘great resignation’ from the state workforce in 2020, new hiring stalled, and the workforce declined more sharply in 2021 than in the prior decade. The state needs to continue to attract and retain a range of diverse employees to be responsive to 21st Century needs, and to ensure that services are provided in a cost-effective manner without excessive use of overtime.”
Most of the state’s overtime in 2021 came from the Office for People with Developmental Disabilities (OPWDD), the Department of Corrections and Community Supervision (Corrections) and the Office of Mental Health (Mental Health). The three agencies accounted for 66% of the overtime hours and 62% of the overtime earnings logged by all state agencies in 2021. Overtime also rose significantly at the Office of Children and Family Services (OCFS) and the City University of New York (CUNY), where hours increased more than 25% and overtime earnings more than 45%.
Key Findings Related to Overtime in 2021
- State agencies accrued 19.9 million hours of overtime in 2021, 819,471 hours more than in 2020.
- Fewer than one in five state agency employees works overtime. However, seven state agencies had more than 25% of their workforce accruing overtime in 2021. OPWDD had the highest share, at 49.1%, followed by Veterans’ Homes at 48.6%.
- Pay per overtime hour averaged $46.33. The State Police paid the highest average hourly rate, at $83.13 per overtime hour. CUNY paid the next highest, at $63.38, followed by the Unified Court System at $59.41.
State Workforce Trends
During the ten-year period from 2012 to 2021 analyzed by DiNapoli’s office, the average number of employees working for the state, not including SUNY and CUNY, declined 9.1%. This decline included a drop from 160,487 employees in 2012 to almost 154,000 in 2020. In 2021 alone the workforce decreased by 5.3%, or 8,113 employees, from 2020.
During the period 2012 to 2021, Corrections, OPWDD and Mental Health had workforce reductions of 11.6%, 18.7%, and 13.2%, respectively. Employees at Corrections (1,844) and OPWDD (1,521) also shrank by the greatest number of positions between 2020 and 2021, while OCFS and Veterans’ Homes suffered reductions of almost 10%. Individual agency workforce count changes resulted from a variety of factors, including new initiatives, reductions due to efficiencies, transfers of functions between agencies and consolidation of functions within certain agencies.
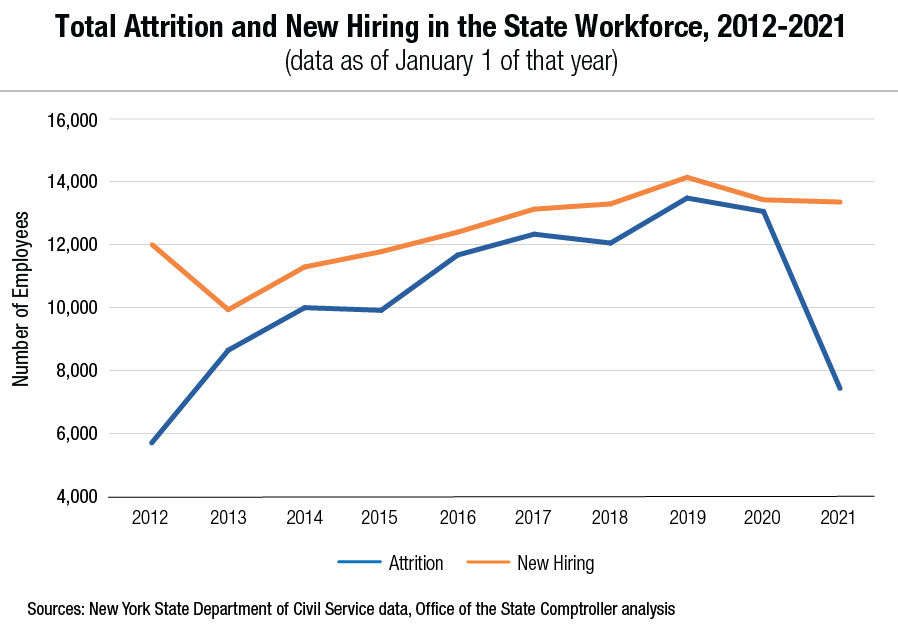
The COVID-19 pandemic does not appear to have accelerated attrition from the state workforce through 2020. Attrition includes retirements and other separations (consisting of resignations, terminations, layoffs and deaths). During this ten-year period, attrition grew and peaked during 2018, with 14,142 people leaving the state workforce. Attrition declined to 13,427 in January 2020, and was slightly lower, 13,357, in January 2021, which reflects the first year of state government operations during the pandemic.
Attrition outpaced new hiring between Jan. 1, 2012, and Jan. 1, 2021. After a low for this period of roughly 5,700 in 2012, new hires peaked at 13,483 on Jan. 1, 2019, and then decreased to 7,435 in 2021.
Report
New York State Agency Use of Overtime and State Workforce Trends, 2012-2021
Track state and local government spending at Open Book New York. Under State Comptroller DiNapoli’s open data initiative, search millions of state and local government financial records, track state contracts, and find commonly requested data.


