
The Office of the State Comptroller has created this tool to document State and City emergency spending related to people seeking asylum. The information will be updated quarterly. Data are available for download below.
State Spending
The State Fiscal Year (SFY) 2027 Enacted Budget Financial Plan indicates the State plans to spend $3.9 billion between SFY 2023 through SFY 2027 for emergency spending related to people seeking asylum in the United States. The FY 2027 Enacted Budget provides no new appropriations for asylum seeker assistance, instead relying on the expenditure of previously allocated funds to support New York City’s ongoing humanitarian response.
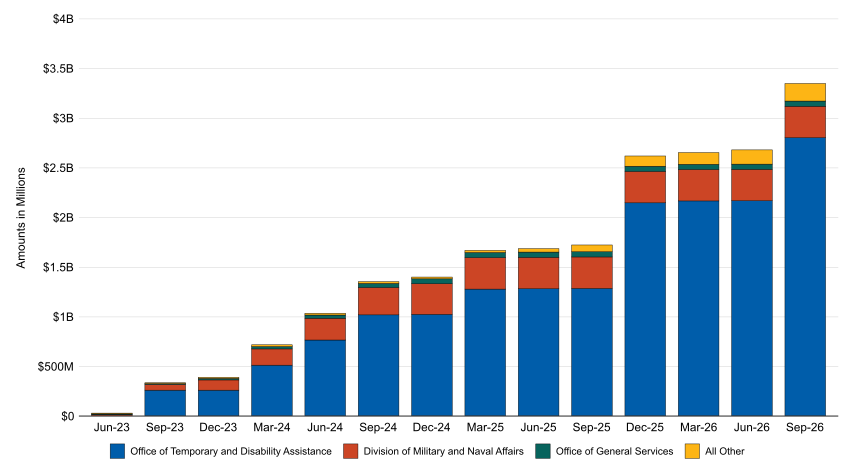
Emergency spending for asylum seekers totaled $3.34 billion through September 30, 2026.
Figure 1 – State Spending by Agency
(through month ending)
- Figure 1 Data Table
Date Office of Temporary and
Disability AssistanceDivision of Military and
Naval AffairsOffice of General Services All Other Total June 2023 $0 $5,597,788 $2,405 $34,727 $5,634,920 September 2023 $256,412,495 $57,339,473 $1,782,974 $660,997 $316,195,939 December 2023 $256,436,442 $102,815,040 $15,695,140 $10,803,290 $385,749,912 March 2024 $508,063,466 $163,484,468 $24,174,390 $17,295,632 $713,017,956 June 2024 $761,143,229 $219,290,449 $32,411,484 $17,477,042 $1,030,322,204 September 2024 $1,014,482,368 $275,419,507 $41,215,330 $17,694,839 $1,348,812,044 December 2024 $1,019,885,635 $307,482,377 $49,721,556 $17,977,803 $1,395,067,371 March 2025 $1,273,761,602 $316,467,014 $52,240,934 $21,312,393 $1,663,781,944 June 2025 $1,277,659,846 $316,335,626 $52,470,208 $34,559,692 $1,681,025,372 September 2025 $1,281,044,932 $316,335,696 $52,301,406 $68,288,960 $1,717,970,994 December 2025 $2,142,320,571 $316,335,696 $52,301,406 $102,879,080 $2,613,836,753 March 2026 $2,161,564,930 $316,335,696 $52,301,406 $117,674,424 $2,647,876,455 June 2026 $2,163,266,306 $316,335,696 $52,301,406 $143,245,523 $2,675,148,931 September 2026 $2,798,176,270 $316,335,696 $52,301,406 $176,486,449 $3,343,299,821
Note: Spending from April 1, 2023 through September 30, 2026.
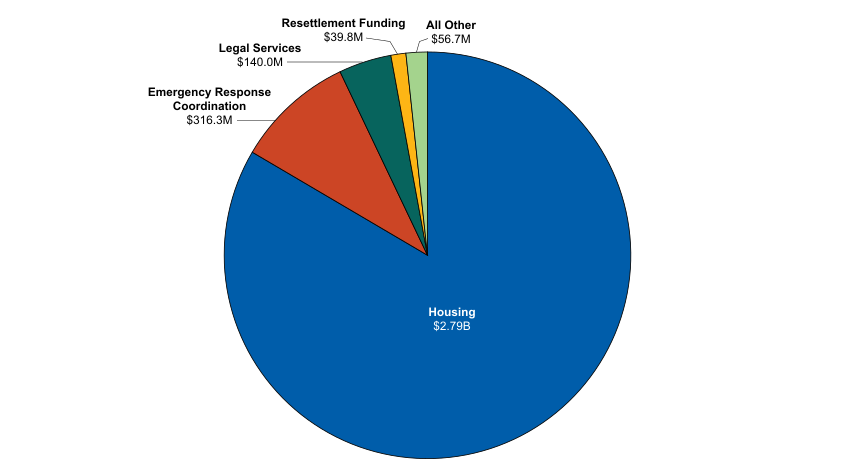
Figure 2 – Total Spending by Activity
(through month ending)
- Figure 2 Data Table
Activity State Spending Housing $2,790,383,200 Emergency Response Coordination $316,349,988 Legal Services $140,035,964 Resettlement Funding $39,788,256 All Other $56,742,413
Note: All Other includes: Health Care & Related Services, Security, Translation, Transportation and General Services. Spending from April 1, 2023 through September 30, 2026.
New York City Spending
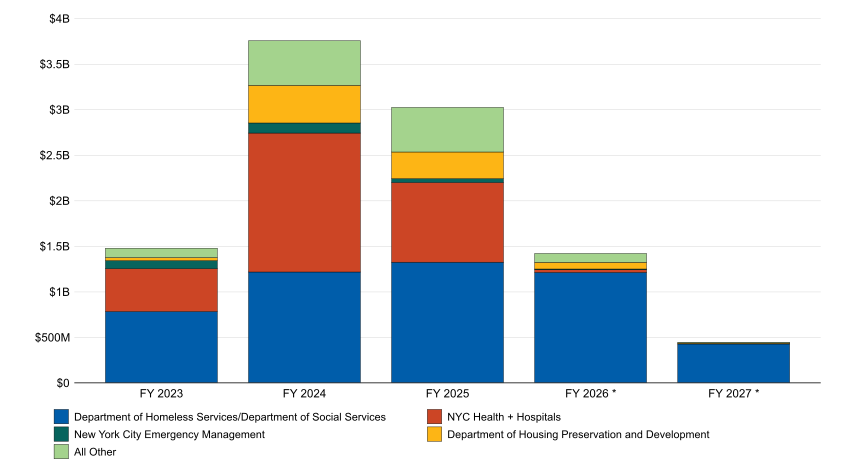
Through September 30, 2026, the City of New York had recorded expenditures of $1.47 billion in Fiscal Year (FY) 2023, $3.75 billion in FY 2024, $3.02 billion in FY 2025, $1.53 billion in FY 2026 and $434 million in FY 2027 (FY 2026 and FY 2027 expenses are not yet final). The largest cumulative spending is for payments to the Department of Homeless Services (DHS) for emergency shelter costs, followed by NYC Health + Hospitals (H+H), which led the operation of the Humanitarian Emergency Response and Relief Centers (HERRCs). By FY 2026, costs shifted predominantly to DHS as the City closed multiple HERRCs.
As of the City’s June 2026 Financial Plan, its anticipated cost projections total $1.2 billion in FY 2027, and $500 million annually in FY 2028, FY 2029 and FY 2030, reflecting a continued expected decline in the number of people in the City's care.
Figure 3 – New York City Asylum Seeker Expenses by Agency, FY 2023 – FY 2027
(through September 30, 2026)
- Figure 3 Data Table
Year Department of Homeless Services/Department
of Social ServicesNYC Health + Hospitals New York City Emergency Management Department of Housing Preservation and Development All Other Total Fiscal Year 2023 $779,506,150 $468,792,666 $89,497,398 $33,425,232 $102,464,663 $1,473,686,110 Fiscal Year 2024 $1,212,876,546 $1,525,255,797 $110,747,920 $413,489,543 $489,621,210 $3,751,991,016 Fiscal Year 2025 $1,320,725,129 $874,429,634 $42,895,695 $292,055,940 $489,488,755 $3,019,595,154 Fiscal Year 2026 * $1,208,832,013 $28,441,130 $5,073,681 $73,234,613 $97,155,153 $1,412,736,591 Fiscal Year 2027 * $422,573,835 $0 $0 $9,938,296 $1,046,411 $433,558,543
Note: New York City fiscal year is from July 1 to June 30.
* FY 2026 and FY 2027 expenses have not yet been finalized.