By supporting local businesses, helping to create jobs and paying their fair share of taxes, NYSLRS retirees contribute to the economic health of our communities. And because NYSLRS provides a lifetime monthly benefit retirees can count on, pensions boost local economies in good times and bad, helping to build a stronger New York.
During 2024, approximately 79 percent of NYSLRS retirees and beneficiaries lived in NY and were responsible for $19.2 billion in economic activity.
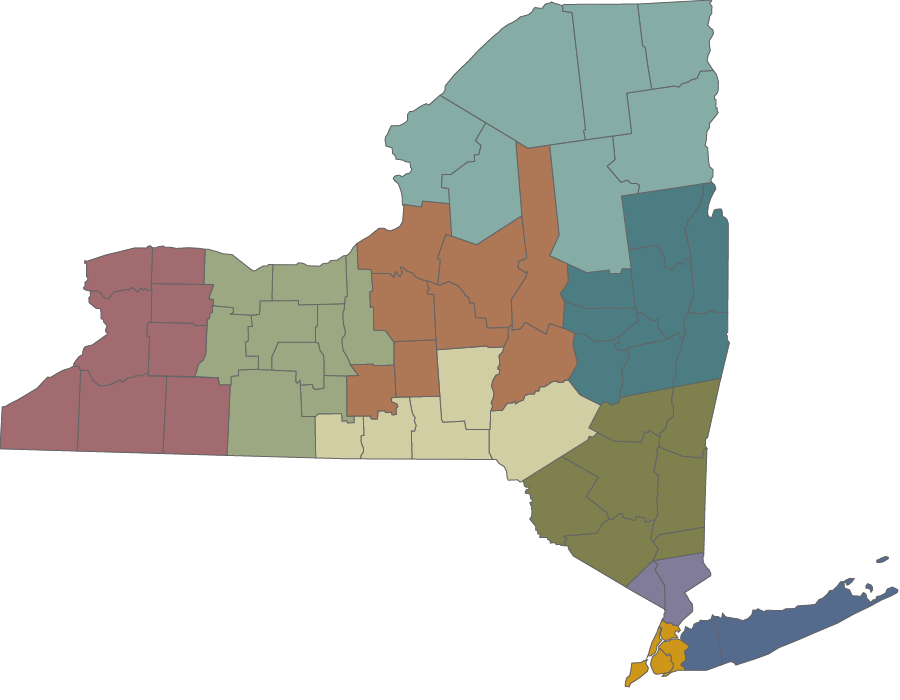
Click on a region or see statewide impact.
Retirees Contribute Map
Retirees Contribute - Upper Hudson Valley
Retirees and beneficiaries: 41,440 (3.5% of the region’s population)
- Paid $265 million in property taxes (6.3% of the property taxes collected in the region).
- Generated $107 million in State and local sales tax.
- Spent approximately $1.9 billion on goods and services, supporting 8,500 jobs.
Retirees Contribute - Southern Tier
Retirees and beneficiaries: 19,293 (4.6% of the region’s population)
- Paid $71 million in property taxes (7.4% of the property taxes collected in the region).
- Generated $36 million in State and local sales tax.
- Spent $680 million on goods and services, supporting 2,800 jobs.
Retirees Contribute - North Country
Retirees and beneficiaries: 23,738 (5.8% of the region’s population)
- Paid $82 million in property taxes (8.6% of the property taxes collected in the region).
- Generated $42 million in State and local sales tax.
- Spent $760 million on goods and services, supporting 3,000 jobs.
Retirees Contribute - New York City
Retirees and beneficiaries: 24,290 (0.3% of the region’s population)
- Paid $52 million in property taxes (0.2% of the property taxes collected in the region).
- Generated $69 million in State and local sales tax.
- Spent approximately $1.1 billion on goods and services, supporting 4,300 jobs.
Retirees Contribute - Lower Hudson Valley
Retirees and beneficiaries: 24,967 (1.8% of the region’s population)
- Paid $245 million in property taxes (3.7% of the property taxes collected in the region).
- Generated $69 million in State and local sales tax.
- Spent approximately $1.2 billion on goods and services, supporting 5,300 jobs.
Retirees Contribute - Long Island
Retirees and beneficiaries: 67,291 (2.3% of the region’s population)
- Paid $685 million in property taxes (5.4% of the property taxes collected in the region).
- Generated $209 million in State and local sales tax.
- Spent approximately $3.5 billion on goods and services, supporting 19,000 jobs.
Retirees Contribute - Finger Lakes
Retirees and beneficiaries: 42,481 (3.4% of the region’s population)
- Paid $177 million in property taxes (5.6% of the property taxes collected in the region).
- Generated $77 million in State and local sales tax.
- Spent approximately $1.4 billion on goods and services, supporting 7,500 jobs.
Retirees Contribute - Central New York
Retirees and beneficiaries: 45,051 (3.9% of the region’s population)
- Paid $168 million in property taxes (6.5% of the property taxes collected in the region).
- Generated $86 million in State and local sales tax.
- Spent approximately $1.5 billion on goods and services, supporting 7,600 jobs.
Retirees Contribute - Capital District
Retirees and beneficiaries: 66,979 (5.9% of the region’s population)
- Paid $271 million in property taxes (9.4% of the property taxes collected in the region).
- Generated $135 million in State and local sales tax.
- Spent approximately $2.6 billion on goods and services, supporting 12,800 jobs.
Retirees Contribute - Western New York
Retirees and beneficiaries: 60,030 (3.9% of the region’s population)
- Paid $207 million in property taxes (6.4% of the property taxes collected in the region).
- Generated $120 million in State and local sales tax.
- Spent approximately $2.1 billion on goods and services, supporting 10,600 jobs.
Note: Information is based on estimated figures.
Sources: 2025 NYSLRS Annual Comprehensive Financial Report, U.S. Census Bureau, OSC analysis.
