
Medicaid is a health insurance program jointly funded by the federal government and the states; in New York, counties and the City of New York also make contributions to the program. While the federal government sets some requirements for coverage and other aspects of the program, states have considerable flexibility to shape their programs, including eligibility and scope of service. Changes made in Public Law 119-21 will affect Medicaid enrollees, including eligibility, work requirements, renewals, and retroactive coverage; these changes are being phased in over time.
The federal government’s contribution is based on the federal medical assistance percentage (FMAP), which is a ratio determined by comparing a state’s per capita income to the U.S. average. Since New York is a relatively wealthier state, it receives a statutory minimum FMAP of 50 percent reimbursement of certain state Medicaid expenditures. Medicaid expansion authorized under the Affordable Care Act for non-elderly adults with incomes up to 138 percent of the federal poverty level also provided the state with a 90 percent FMAP for these individuals.
In SFY 2026, federal Medicaid spending totaled $58.5 billion out of a total of $110.8 billion. Total Medicaid spending is projected by the Division of the Budget (DOB) to grow to $135.1 billion in SFY 2030, of which $68.5 billion is expected to be federally funded.
New York has defined eligibility for Medicaid more broadly than many other states, and enrollment in Medicaid is second only to California. In February 2026, enrollment in Medicaid totaled almost 6.7 million, and is projected by DOB to rise over 7 million in the outyears of DOB’s Financial Plan. About one-third (33.4 percent) of the State’s residents were enrolled in Medicaid.
In February 2026, New York City residents constituted 56.4 percent of Medicaid enrollment in the state; however, Medicaid covers a significant share of residents in counties around the state. Medicaid covered at least 25 percent of residents in 36 counties, with a low of 13.8 percent in Hamilton County to a high of 62.7 percent in the Bronx.
Medicaid enrollment since February 2026 has trended down by approximately 307,000 enrollees, or 4.6 percent, following a large drop in enrollment as reported in the March 2026 data. How enrollment changes as the effects of Public Law 119-21 are effectuated will be seen in the data as future reports are released.
New York Medicaid Spending by Level of Government, SFY 2017 – SFY 2027
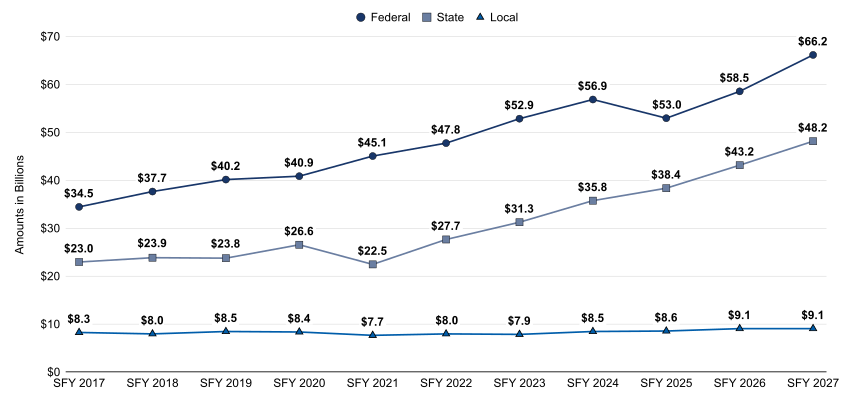
- Data Table – New York Medicaid Spending by Level of Government, SFY 2017 – SFY 2027
SFY 2017 SFY 2018 SFY 2019 SFY 2020 SFY 2021 SFY 2022 SFY 2023 SFY 2024 SFY 2025 SFY 2026 SFY 2027 Federal $34.5 $37.7 $40.2 $40.9 $45.1 $47.8 $52.9 $56.9 $53.0 $58.5 $66.2 State $23.0 $23.9 $23.8 $26.6 $22.5 $27.7 $31.3 $35.8 $38.4 $43.2 $48.2 Local $8.3 $7.9 $8.5 $8.4 $7.7 $8.0 $7.9 $8.5 $8.6 $9.1 $9.1
Note: Pursuant to State law, the amount of county contributions has remained capped at calendar year 2015 levels. SFY 2027 amounts are estimates; all other years are actual.
Source: NYS Division of the Budget
New York Medicaid Enrollment, Month of February, CY 2017 – CY 2026 and CY 2026 Months Since
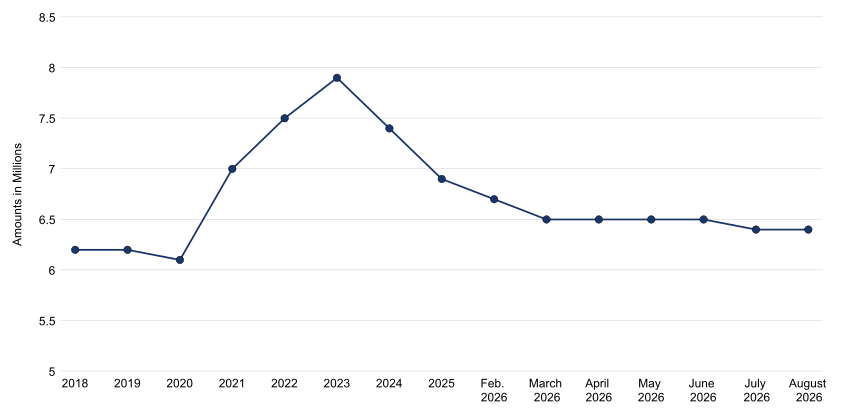
- Data Table – New York Medicaid Enrollment, Month of February, CY 2017 – CY 2026 and CY 2026 Months Since
2017 2018 2019 2020 2021 2022 2023 2024 2025 Feb. 2026 March 2026 April 2026 May 2026 June 2026 July 2026 August 2026 Total 6.1 6.2 6.2 6.1 7.0 7.5 7.9 7.4 6.9 6.7 6.5 6.5 6.5 6.5 6.4 6.4
Note: Medicaid enrollment hit a high of a little over 8 million in June 2023 because federal legislation enacted during the pandemic prohibited states from disenrolling people from Medicaid for the duration of the public health emergency.
Source: NYS Department of Health
Medicaid Enrollment by County
- Data Table – Medicaid Enrollment by County
District Enrollment Percent Enrolled Albany 68,023 21.2% Allegany 12,197 26.1% Bronx 837,340 59.5% Broome 54,033 27.6% Cattaraugus 21,363 28.3% Cayuga 19,097 25.7% Chautauqua 38,101 30.7% Chemung 29,251 36.4% Chenango 13,995 30.6% Clinton 19,429 24.9% Columbia 13,943 23.2% Cortland 11,636 25.4% Delaware 10,270 23.2% Dutchess 58,804 19.6% Erie 246,827 26.1% Essex 7,865 21.6% Franklin 14,480 31.1% Fulton 14,861 28.5% Genesee 12,632 21.6% Greene 12,015 25.4% Hamilton 673 13.4% Herkimer 16,296 27.5% Jefferson 28,012 25.1% Kings (Brooklyn) 1,181,593 44.5% Lewis 5,162 19.5% Livingston 11,423 18.6% Madison 15,379 22.9% Monroe 195,165 26.0% Montgomery 18,281 36.5% Nassau 284,524 20.3% New York (Manhattan) 415,441 25.0% Niagara 52,792 25.3% Oneida 68,815 30.4% Onondaga 115,741 24.8% Ontario 22,130 19.6% Orange 124,877 29.9% Orleans 10,795 27.1% Oswego 32,821 27.7% Otsego 13,125 21.7% Putnam 16,580 16.7% Queens 961,841 40.8% Rensselaer 35,327 22.0% Richmond (Staten Island) 170,525 34.0% Rockland 151,296 42.3% Saint Lawrence 27,787 26.3% Saratoga 36,138 15.0% Schenectady 45,734 28.1% Schoharie 7,081 23.5% Schuyler 3,420 20.2% Seneca 7,582 23.1% Steuben 25,760 28.0% Suffolk 340,257 22.0% Sullivan 27,652 34.3% Tioga 11,861 25.0% Tompkins 16,333 15.7% Ulster 47,355 25.8% Warren 15,148 23.3% Washington 15,977 26.9% Wayne 20,950 23.0% Westchester 218,330 21.5% Wyoming 8,743 22.0% Yates 4,836 19.7%