
Employment Statewide Rose in 2019; Three Regions Lost Jobs
- In calendar year 2019, the State added over 100,000 jobs, an increase of 1.0 percent compared to national employment growth of 1.4 percent.
- New York ranked 20th among the states for job growth in 2019 and 15th for the five years ending in 2019.
- The State’s unemployment rate declined from 4.1 percent in 2018 to 4.0 percent in 2019.
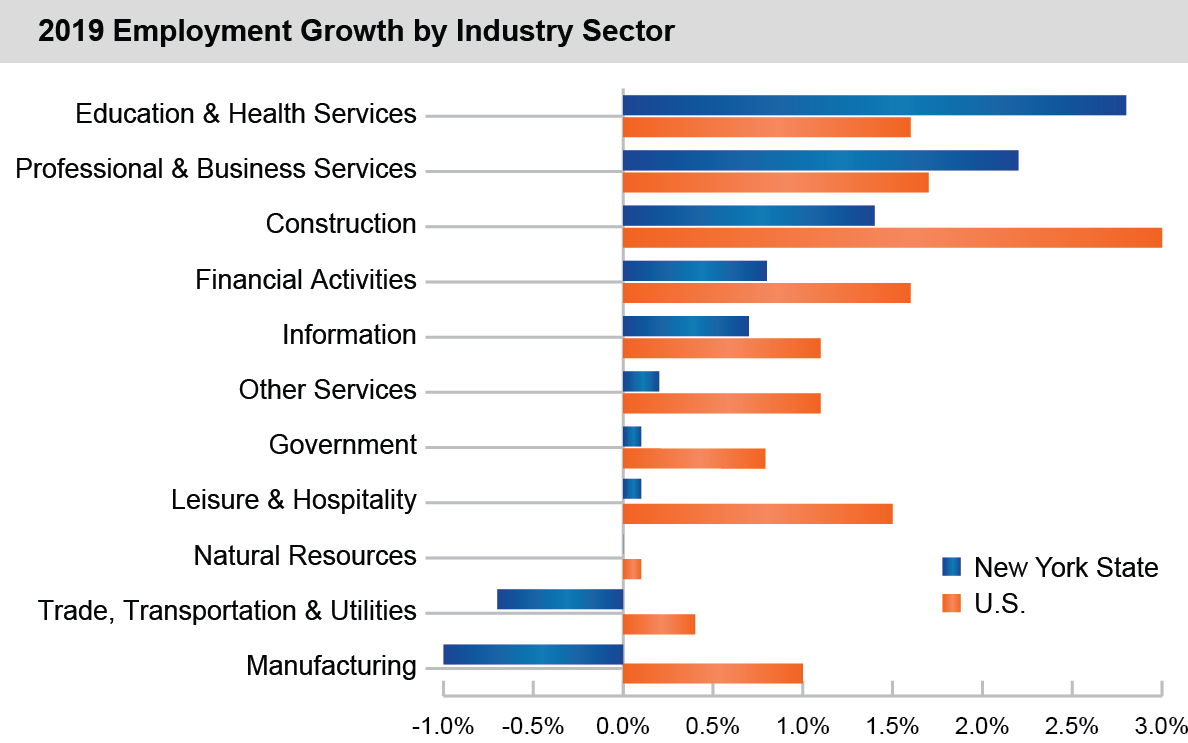
- In 2019, the highest rate of employment growth was in education and health services, with an increase of 2.8 percent. This industry sector also added the largest number of jobs, over 72,000.
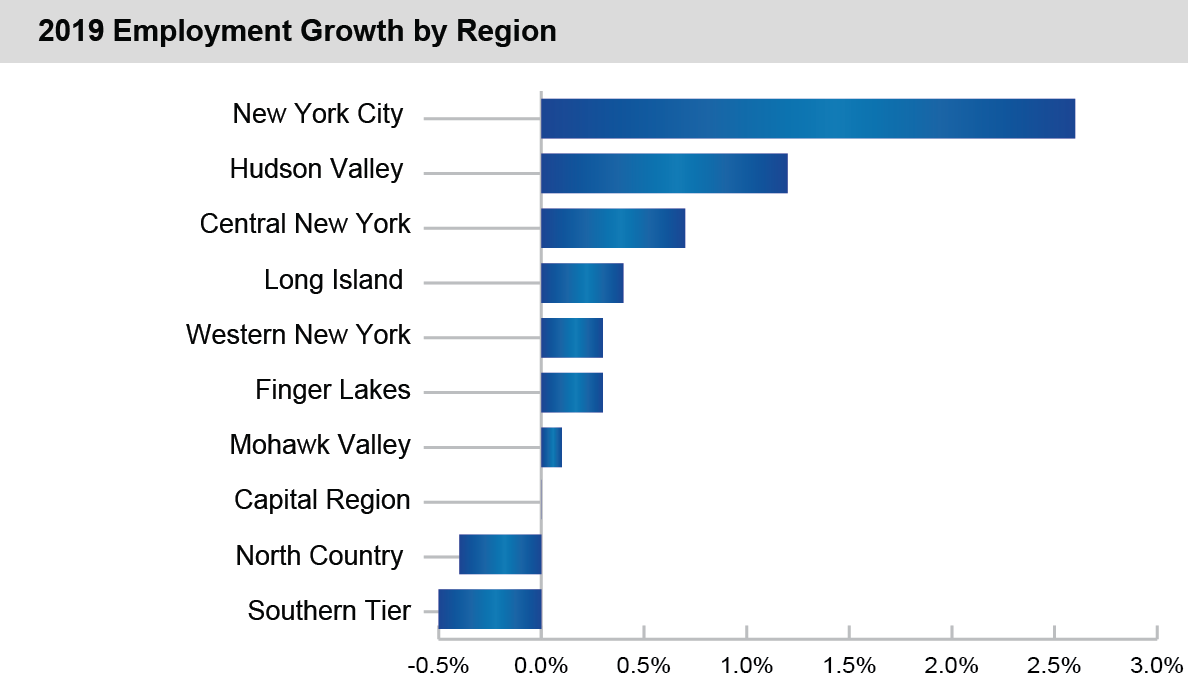
- In 2019, seven of the ten regions in the State had increased employment. New York City had the highest growth rate of any region (2.6 percent) while the Capital Region, North Country and Southern Tier all had job losses.
Wages in the State Increase
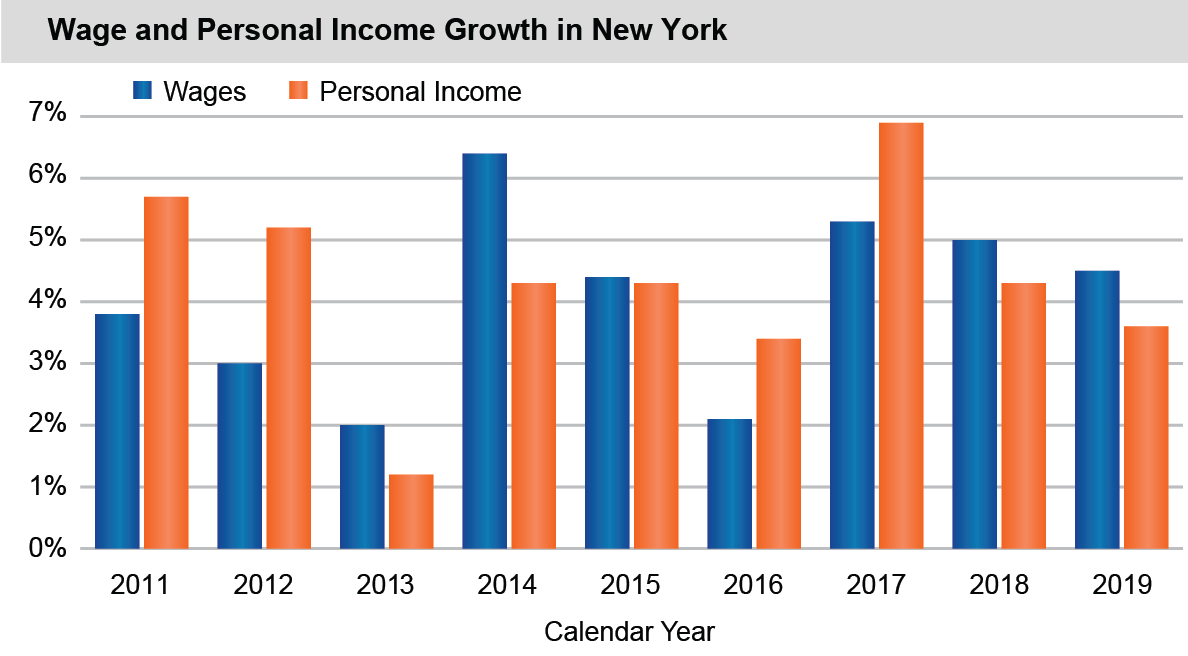
- In 2019, total wages in the State increased by 4.5 percent. Those in the professional services sector had the highest rate of growth, 7.1 percent, while the construction industry had the lowest, 1.2 percent.
- Average annual wages for all industries in the State increased by over $2,400 (3.4 percent).
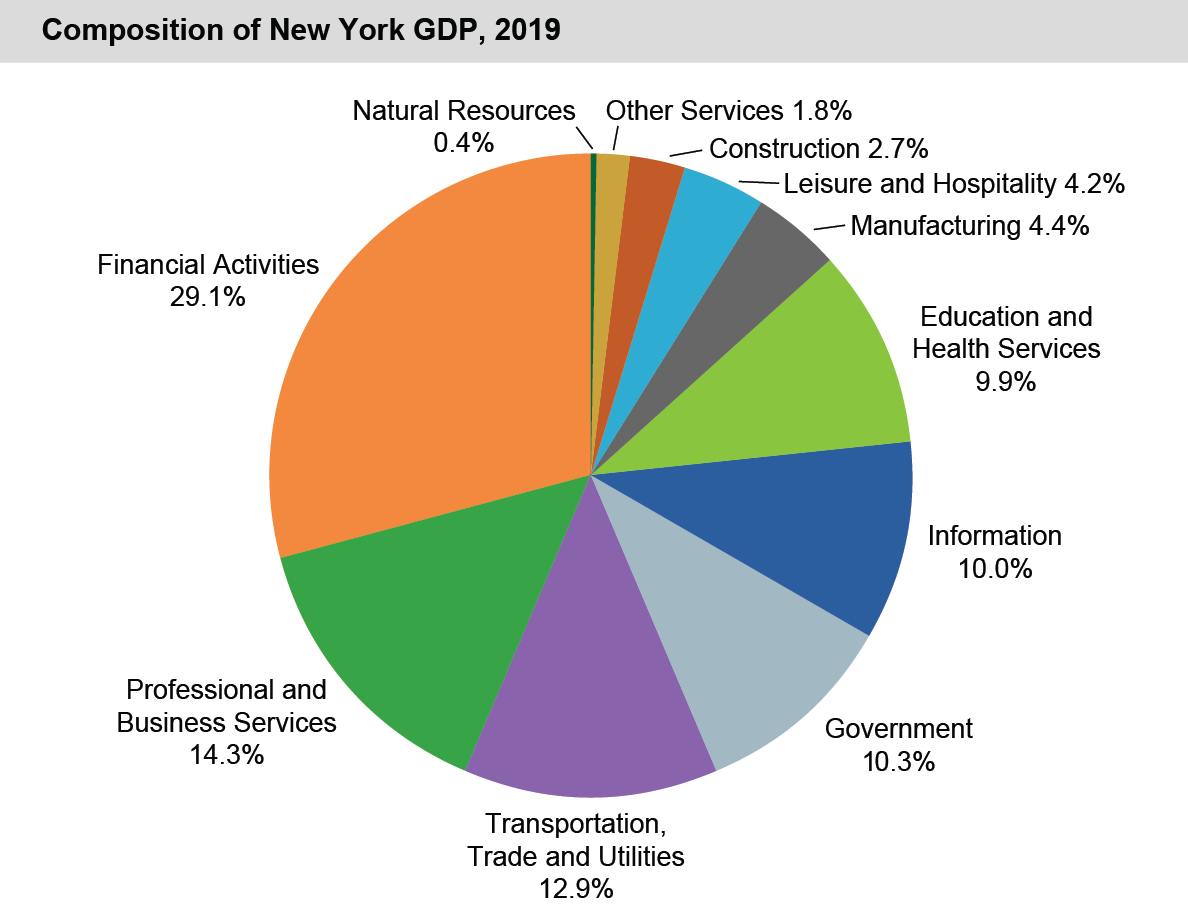
NYS GDP Reached Nearly $1.5 Trillion
A state’s Gross Domestic Product (GDP) is the value of production originating from all industries in the state, as defined by the U.S. Bureau of Economic Analysis. The figures above related to employment and wages reflect a continued trend of gains in those indicators in recent years, and the same is true with the State’s GDP. In 2019:
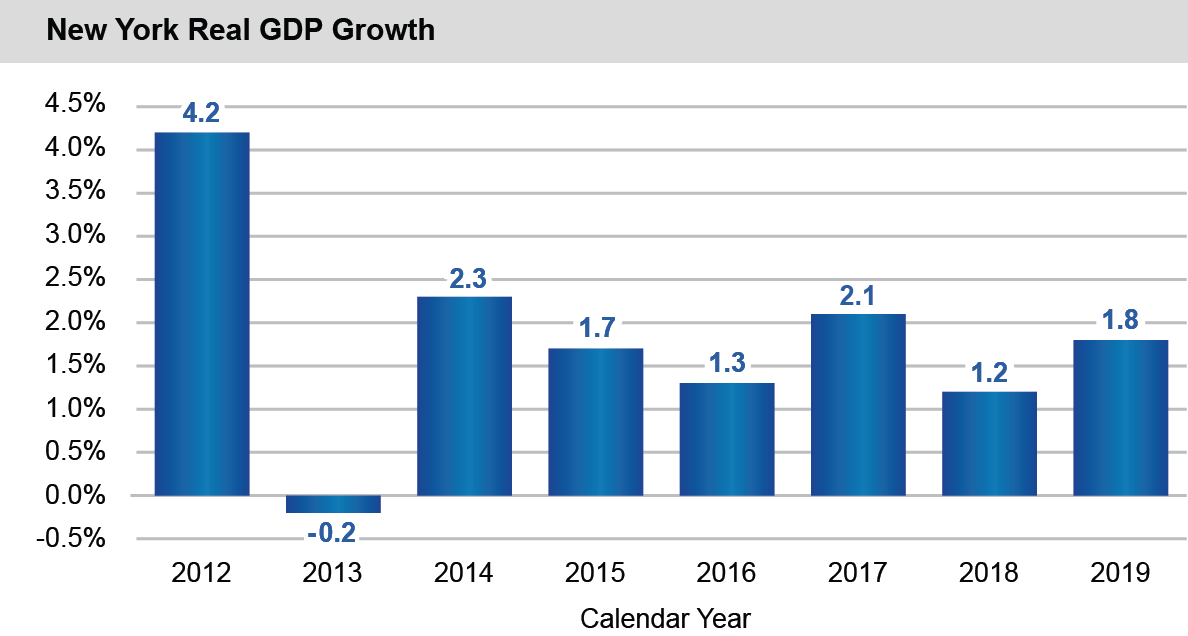
- New York State’s real GDP was nearly $1.5 trillion, 7.7 percent of the U.S. total. On a per capita basis, New York State’s GDP was 29.3 percent higher than the national average.
- The State ranked 31st in the nation for economic growth with a real GDP increase of 1.8 percent, an acceleration from 1.2 percent in 2018. Texas ranked first among the states at 4.4 percent.
- The financial activities sector comprised the largest share of the State’s GDP in 2019 at 29.1 percent. The second and third top industries—professional and business services and transportation, trade, and utilities—together make up 27.2 percent.
New York’s Population Has Grown, But Much More Slowly Than the Nation’s
- From 2010 to 2019, the State’s population increased by 0.4 percent, compared to a national pace of 6.3 percent.
- The population in the State has been declining since 2015, with a net loss of over 201,000 residents through 2019.
- Immigrants have mitigated the population loss, with a net increase of over 341,000 in the same period.
- Immigrants accounted for nearly 23 percent of the population in 2018.